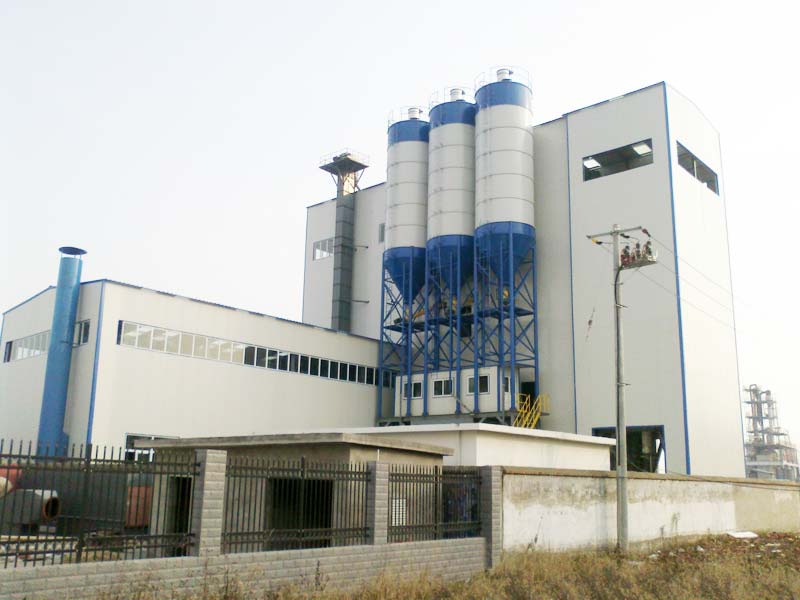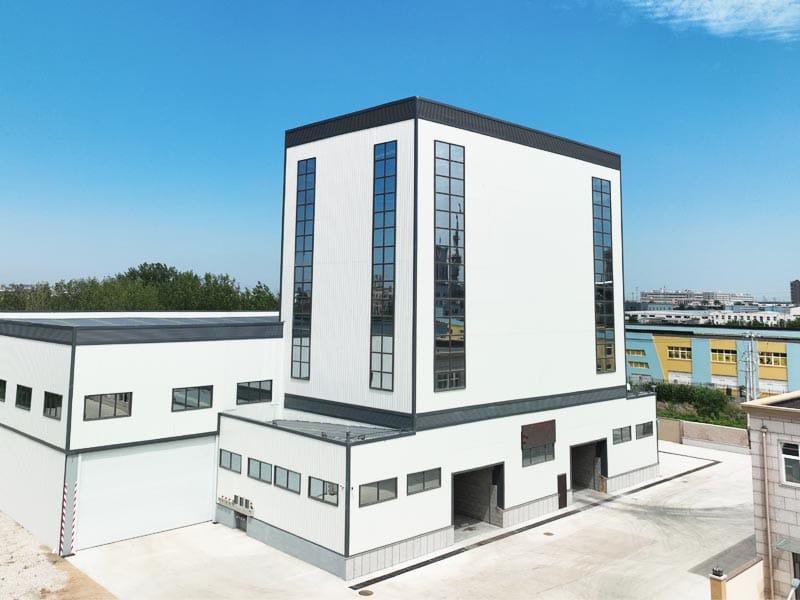
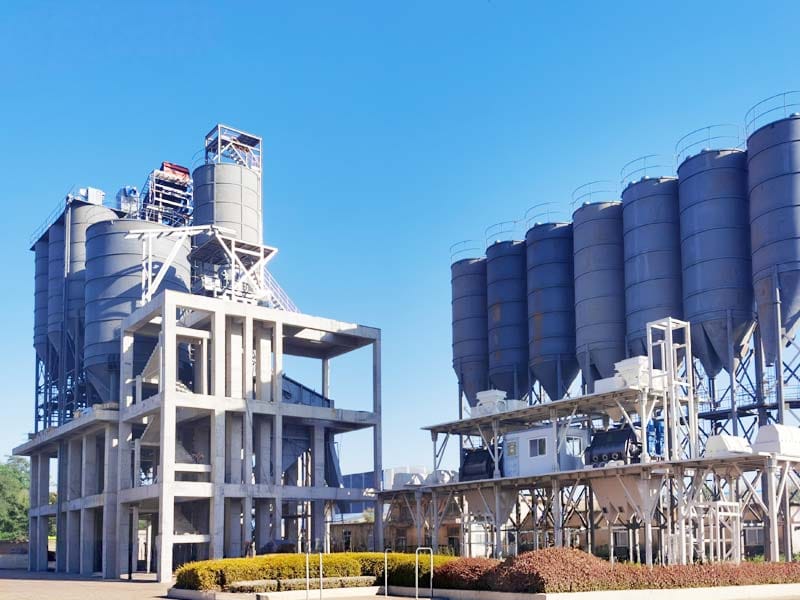
A sand grading curve is one of the most useful documents for selecting a manufactured sand and dry mortar production system. It shows how the material is distributed across different particle sizes, which helps determine whether one sand fraction can be used directly, whether several fractions should be separated, and how many storage bins the mortar plant may need.
For equipment buyers, the curve should not be treated as a laboratory chart that belongs only to quality control. It directly affects screening, classification, storage, dosing and even packaging. A plant designed around one broad sand fraction may become inflexible if the product portfolio later needs a narrower fine fraction for tile adhesive or self-leveling mortar.
Our diproduksi lini produksi pasir combines VSI crushing, circular screening and airflow powder classification, while our pabrik pasir dan mortar khusus yang diproduksi secara terintegrasi links those classified sand fractions directly with downstream dry mortar production. This guide explains how to read a sand grading curve and turn it into practical plant decisions.
What Is a Sand Grading Curve?

A sand grading curve plots particle-size distribution across a series of sieves. One axis shows sieve size, while the other normally shows cumulative percentage passing.
ASTM C136/C136M-25 is the current ASTM test method for determining particle-size distribution of fine and coarse aggregates by sieving. ASTM notes that the results are used both to check compliance with aggregate specifications and to control production of aggregate products and mixtures containing aggregates.
That makes the sand grading curve useful for both quality and equipment design.
A curve can help answer:
- Is the sand generally coarse or fine?
- Does it have a broad or narrow distribution?
- Are important size fractions missing?
- Is there too much material in the fine end?
- Should one sand be separated into several product streams?
Understand Percentage Passing Before Reading the Curve
Most grading curves use cumulative percentage passing.
If 80% passes a 1.18 mm sieve, that means 80% of the sample is smaller than 1.18 mm and 20% is retained on that sieve or larger sieves.
Consider a simple example:
| Sieve size | Percent passing | Interpretation |
|---|---|---|
| 2.36 mm | 100% | All material is smaller than 2.36 mm |
| 1.18 mm | 82% | 18% is 1.18 mm or larger |
| 0.60 mm | 54% | 46% is 0.60 mm or larger |
| 0.30 mm | 28% | 72% is 0.30 mm or larger |
| 0.15 mm | 12% | 12% is finer than 0.15 mm |
A sand grading curve turns these numbers into a visual profile.
The Curve Shape Shows How Broad the Grading Is
A smooth curve extending across several sieve sizes indicates a broader particle distribution.
A steep curve over a narrow sieve range indicates that most particles are concentrated within a smaller size range.
For mortar plant selection, this matters because:
- broadly graded sand may be usable directly for some products;
- narrow fractions can be useful for controlled blending;
- special mortars may need separate fine and medium fractions;
- very narrow grading can increase dependence on filler or other fractions to improve packing.
There is no universal ideal curve. The correct sand grading curve depends on the mortar product.
Do Not Judge a Sand Only by Maximum Particle Size
Two sands can both be labeled 0–3 mm and still have very different particle distributions.
One may contain most of its mass between 1 and 3 mm. Another may contain a much larger proportion below 0.5 mm.
Both fit the same nominal envelope, but they can behave differently in:
- kebutuhan air;
- kepadatan massal;
- pengepakan;
- kemampuan mengalir;
- mixer loading;
- selesai mortir kinerja.
This is why a sand grading curve provides more useful design information than one maximum size.
Look for Gaps in the Particle Distribution
A grading gap appears when one intermediate size fraction is underrepresented.
On the curve, this can show up as a flatter section where little material passes between two adjacent sieves.
A gap is not automatically unacceptable, but it can affect packing and formulation behavior.
For mortar plant selection, a gap may indicate that:
- the crushing process produces an uneven size distribution;
- one screen fraction is missing;
- separate blending may improve control;
- a product-specific sand fraction should be added.
The plant designer should compare the sand grading curve with the approved mortar formula rather than trying to create a “perfect” continuous curve by default.
Fine-End Slope Helps Reveal Powder-Rich Sand
The lower end of the sand grading curve shows how much fine material is present.
If a large percentage of the sample passes the smallest selected sieves, the sand may contain a high proportion of fine particles or powder.
This can be useful or excessive depending on the product.
For dry mortar:
- tile adhesive may use a controlled fine fraction;
- self-leveling mortar may need tight fine-particle control;
- masonry mortar can use a broader aggregate range;
- repair mortar can require grading matched to application thickness.
Our pasir halus untuk pemandu mortir explains why one fine-sand range should not be applied to all mortar products.
Use ASTM C117 for Very Fine Material
ASTM C136/C136M-25 notes that accurate determination of material finer than the 75 μm sieve cannot be achieved by sieve analysis alone and refers to ASTM C117 for that fine fraction.
This matters when reading a sand grading curve because the very fine end may influence:
- kandungan bubuk;
- kebutuhan air;
- air classification;
- dust generation;
- mortar flow.
The grading curve and fine-powder test should therefore be reviewed together.
Fineness Modulus Is Useful but Not Enough
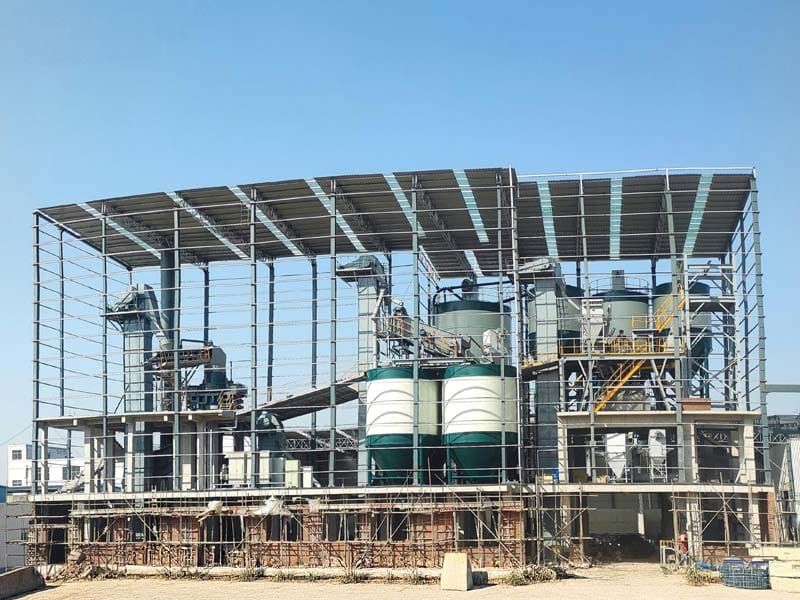
Fineness modulus condenses a grading into one index.
It can be useful for comparing sands quickly, but it does not replace the full sand grading curve.
Two sands can have similar fineness modulus values while distributing particles differently across critical sieve sizes.
For mortar plant selection, use fineness modulus as a summary indicator, then return to the actual curve for decisions about:
- screening;
- fraction separation;
- storage;
- blending;
- powder classification.
Compare Curves from Several Production Days
One curve shows one sample.
It does not prove that the sand-making process is stable.
For manufactured sand, compare grading curves from:
- different shifts;
- different quarry zones;
- different moisture conditions;
- before and after screen maintenance;
- after VSI wear-part replacement;
- different classifier settings.
A group of curves shows whether the process remains inside an acceptable production band.
This is more useful than one ideal sample taken during commissioning.
Curve Drift Can Point to Upstream Process Changes
If the sand grading curve slowly shifts coarser, investigate the process before changing the mortar formula.
Possible causes include:
- VSI wear;
- changed rotor settings;
- coarser feed;
- screen damage;
- changed return load.
If the curve shifts finer, check:
- feed rock;
- crusher speed;
- screen condition;
- air-classifier setting;
- moisture.
Our VSI sand making guide explains how crushing, screening and recirculation influence the final sand distribution.
Read the Curve Together with the Screen Decks
The grading curve can help determine where screen cuts should be placed.
If the mortar plant needs separate fine and medium sand fractions, the screen should create practical cut points that match those product requirements.
For example, if one product uses mostly sub-0.6 mm sand while another uses a broader 0–2 mm range, the plant may benefit from separating around a relevant sieve size rather than storing one mixed stream.
The actual cut point should come from the validated product design.
The sand grading curve helps show whether enough material exists on each side of that cut to justify separate storage.
Do Not Create Too Many Fractions Without a Product Need
More classification is not automatically better.
Each additional sand fraction can require:
- another screen cut;
- another conveyor or chute;
- another storage bin;
- another weighing channel;
- more cleaning and maintenance;
- more control logic.
For mortar plant selection, the sand grading curve should help identify the minimum number of useful fractions needed to support the product portfolio.
If three mortar products can all use the same approved broad fraction, separating it further may add complexity without technical value.
Use Product Demand to Size Each Sand Bin
Once the useful sand fractions are defined, the next question is how much storage each fraction needs.
The largest bin does not always belong to the coarsest sand.
For each product, calculate:
- sand fraction used per batch;
- batches per hour;
- hours between replenishment;
- number of products using the fraction.
Then size storage around consumption and replenishment.
The sand grading curve defines the fractions, while the mortar production plan defines their storage demand.
Sand Curves Help Balance an Integrated Plant
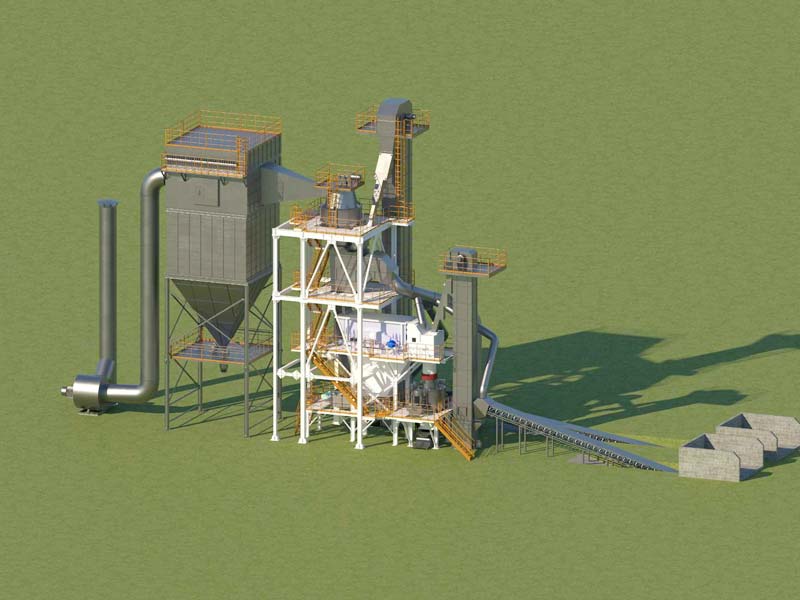
In an integrated sand-and-mortar project, total manufactured sand output is not enough.
The line must produce the specific fractions the mortar plant consumes.
Consider a simplified example:
| Sand fraction | Produced | Required by mortar | Result |
|---|---|---|---|
| 0–0.6 mm | 5 t/h | 8 t/h | Shortage |
| 0.6–1.2 mm | 9 t/h | 6 t/h | Surplus |
| 1.2–3.0 mm | 10 t/h | 5 t/h | Surplus |
Total sand production is 24 t/h while mortar demand is only 19 t/h, yet the plant still lacks enough of the finest fraction.
This is why sand grading curve data should be translated into fraction-by-fraction production balance.
Air Classification Controls the Powder Tail, Not the Whole Curve
Air classification mainly affects the very fine end of the sand distribution.
It does not replace the vibrating screen.
Our dry sand classification guide explains how screening and airflow perform different roles.
When reading the sand grading curve:
- coarse-end problems usually point toward crushing or screening;
- mid-range gaps can point toward screen cuts or blending;
- very fine excess may point toward air classification.
This separation helps engineers adjust the correct part of the process.
Mortar Formulation Changes How the Curve Should Be Judged
The same sand grading curve can be suitable for one product and unsuitable for another.
For masonry mortar, a broad grading may support general workability.
For tile adhesive, the plant may need a much finer controlled fraction.
For self-leveling mortar, the relationship between fine aggregate and powder can be especially sensitive.
For repair mortar, maximum size can depend on placement thickness.
Therefore, mortar plant selection should compare the curve against each product formula rather than against one general sand preference.
Curve Consistency Matters for Automatic Batching
A dry mortar plant can meter sand accurately and still produce variable mortar if the sand itself changes.
If the grading shifts, the same weighed mass can have different bulk density, packing and water demand.
This is why sand grading curve control supports downstream batching consistency.
Keep grading records linked with:
- sand source;
- production date;
- pengaturan pengklasifikasi;
- mortar batch records;
- finished product test results.
That traceability helps the quality team determine whether a mortar change began upstream in sand production.
Use the Curve to Decide Whether Purchased Sand Needs Reclassification
Not every mortar plant produces its own manufactured sand.
If purchased sand arrives with a grading broader than the product needs, the factory may need local screening or fraction storage.
A sand grading curve can reveal whether:
- the incoming material is already usable;
- oversize needs removal;
- a fine fraction should be separated;
- powder content needs adjustment;
- multiple supplier streams should be blended.
This can change the scope of the mortar plant significantly.
Use a Curve Band Instead of One Ideal Line
Production sand will not follow one exact curve every day.
A practical quality plan normally uses an acceptable grading envelope or control band rather than expecting every sample to match one perfect line.
The exact limits should come from the product specification and quality-control program.
For plant selection, the important point is that screening and classification equipment should be able to keep normal production inside that approved operating band.
Do not design a line around an unrealistic assumption that every sample will be identical.
Commission the Sand System with Several Representative Curves
During commissioning, compare feed and product grading under realistic material conditions.
Rekam:
- VSI feed curve;
- pecahan yang disaring;
- finished sand curve;
- kandungan bubuk yang sangat halus;
- return stream grading;
- tingkat pakan;
- kelembaban;
- classifier settings.
This shows how the process transforms the incoming material and whether the selected screen cuts create the useful fractions expected by the mortar plant.
What Should Buyers Send for a Sand and Mortar Plant Review?
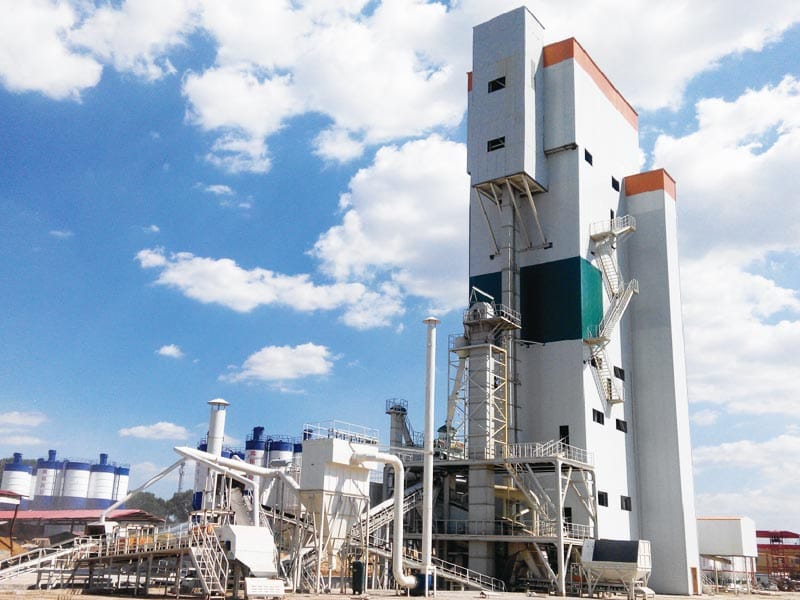
A useful project review should include actual sand grading data.
Menyediakan:
- current or expected sieve analysis;
- parent rock or sand source;
- moisture range;
- powder-content data;
- target mortar products;
- sand grading required by each product;
- required production rate;
- number of sand fractions planned;
- available storage space;
- whether sand is produced in-house or purchased.
Our solusi pasir yang diproduksi can then be reviewed together with the dry mortar process rather than as a separate upstream system.
Send your sand grading curves and mortar product plan through our halaman kontak untuk tinjauan jalur terintegrasi khusus proyek.
Kesimpulan
A sand grading curve is more than a laboratory graph. It shows how much material exists in each particle-size range and helps determine screening, classification, storage and blending requirements.
The most useful interpretation compares the curve with the mortar product portfolio. That reveals which fractions should be kept together, which should be separated, and whether the manufactured sand line can supply enough of each fraction.
Read the curve together with production demand, powder content and process stability. When those data are linked, mortar plant selection becomes far more precise than choosing equipment from one maximum sand size.
FAQ
What does a sand grading curve show?
It shows the cumulative percentage of aggregate passing a series of sieve sizes. The curve reveals whether the sand is coarse, fine, broadly graded, narrowly graded or missing certain particle-size fractions.
Why is a sand grading curve important for dry mortar?
Different mortar products need different sand distributions. The curve helps determine whether one sand can be used directly or whether separate fractions, screening or powder classification are needed.
Is fineness modulus enough to select sand?
No. Fineness modulus is a useful summary index, but two sands with similar values can have different distributions. Plant selection should use the full grading curve.
Can one 0–3 mm sand fraction be used for every mortar?
Not automatically. Tile adhesive, masonry mortar, self-leveling mortar and repair mortar can require different grading. The product formula should define whether the broad fraction is suitable or should be separated.
What data should I send for sand classification equipment selection?
Provide sieve analysis, fines data, moisture, source material, target mortar products, desired sand fractions and required production rates.